

 Next
Next
 CSET: China and US Lead in Scientific Research Publications Output
- Near Zero Energy Consumption Enters Smart Farm Houses
- Shenzhou 12 Taikonauts' Space Walk Shows Full of Success
- Fendouzhe: World-leading Deep-sea Manned Submersible
- BRICS Calls for More Traditional Medicine Involvement in Combating COVID-19


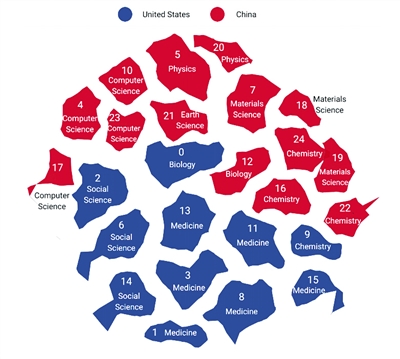 |
| Map of Science: Research Region View (PHOTO: CSET Map of Science) |
The Center for Security and Emerging Technology (CSET) recently released a report titled "Comparing the United States' and China's Leading Roles in the Landscape of Science", which makes a comparative analysis on the output of scientific research publications between China and the US, concluding that China and the US are leading the research publications output around the world.
China and the US at the forefront of research publications output
China and the US produce almost two-thirds of research publications output, with the rest of the world bringing up the rear. According to the report, the US produces 37 percent of the research output and China produces 28 percent, leaving the rest of the world (135 in total) taking only 34 percent (Due to rounding percentages, the three values add to 99 percent).
The report compares the output of research publications in China and the US. It groups nearly 105 million research publications into 126,915 research clusters (RCs), which are aggregated into 25 research regions according to citation links. The only two countries that lead at the research region level are China and the US, with China leading in 14 of the regions, and the US in 11.
China leads in hard science and the US in medicine and soft science
The report reveals that China leads research publications output in STEM (science, technology, engineering and mathematics) fields, whereas the US leads in medicine and social science. The two research regions that have the highest Chinese publication concentrations (30 percent and 25 percent) fall under materials science (mainly chemical engineering, composite materials, and inorganic chemistry) and computer science (represented by computer vision, pattern recognition and algorithms), respectively.
US publication concentrations range from 17 percent to 32 percent, with the research region with the highest publication concentration falling under the social sciences in the broad sense (including law, education, gender studies, clinical psychology, nursing, and psychiatry).
China leads the US by three percentage points in research districts
Each of the 25 research regions (see right figure) is broken down into ten districts, resulting in 250 distinct research districts. China leads in 127 research districts (51 percent), while the US leads in 122 (48 percent) (India leads in 1 research district).
The report gives a further exploration with the research region of computer science as an example, where both China and the US lead. Overlaps of computer networks, information retrieval, and theoretical computer science are found. However, differences between China and the US are also highlighted: China has a strong focus on applied computer science, whereas the US has a strong focus on foundational computer science.
China and the US lead in the highest growing research regions
The highest growing research regions in the two countries show China leading in the second-highest growing research region, which falls under material science and includes RCs that focus on chemical engineering, composite material, and nanotechnology. The US leads in the highest-growing research region, which falls under medicine and includes RCs that contain COVID-19 related research.
China-led research districts, such as computer science, leads in average three-year growth, with natural language processing and data mining as the top two highest growing districts.
Source: CEST